

Cerulion Studio is not open source and has no public download. Book 15 minutes with us to get access. The Cerulion CLI and runtime stay open source — recording, replay, and
--verify all work without Studio.
cerulion CLI, so there is nothing to add to your graph for it: no visualization node, no config file, no script. Check a topic and it renders.
What you can do in Studio
Watch live topics
Check a topic in the sidebar and its frames render on the stage.
See the running graph
The Graph view shows the nodes
cerulion graph run is running, with each node’s rate and liveness.Watch a remote robot
Robots on your network appear under Robots. The robot ships raw bytes; decoding happens on your desk.
Investigate a recording
The Hindsight screen indexes an MCAP bag and names the moment the run went sideways.
The stage
The stage is where live topics render. Camera frames, detections, and plots from the topics you check share one scene, and they update as the graph publishes.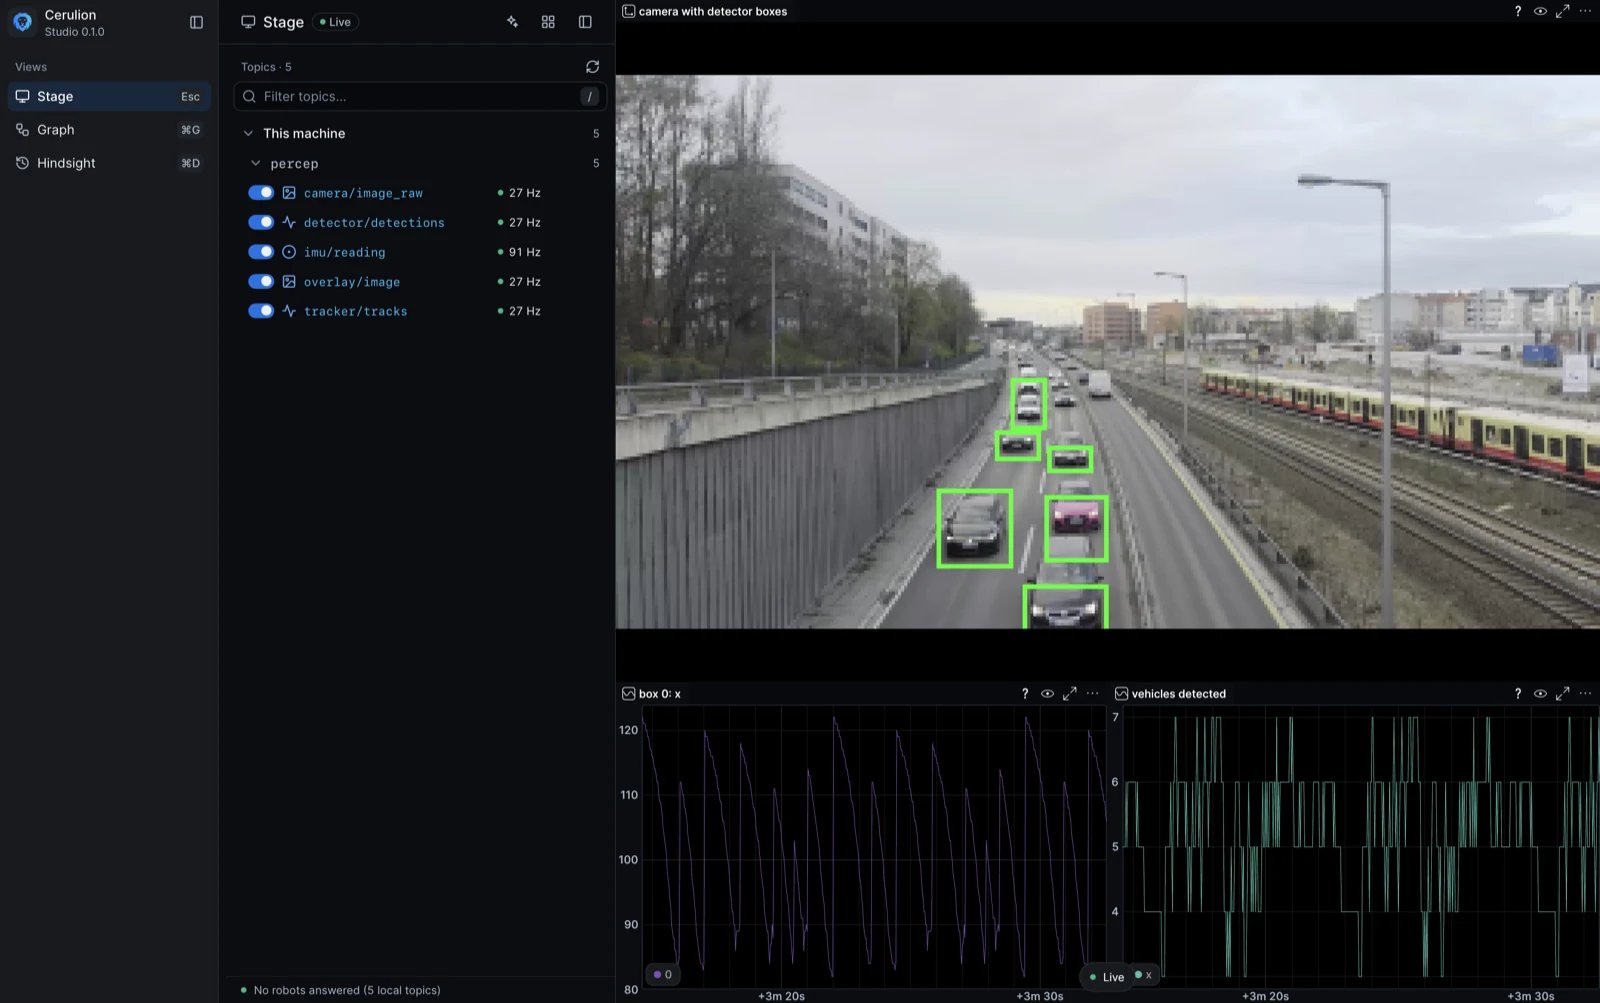
The stage: a live camera topic with detector boxes on the cars, and two plots of the detector's output.
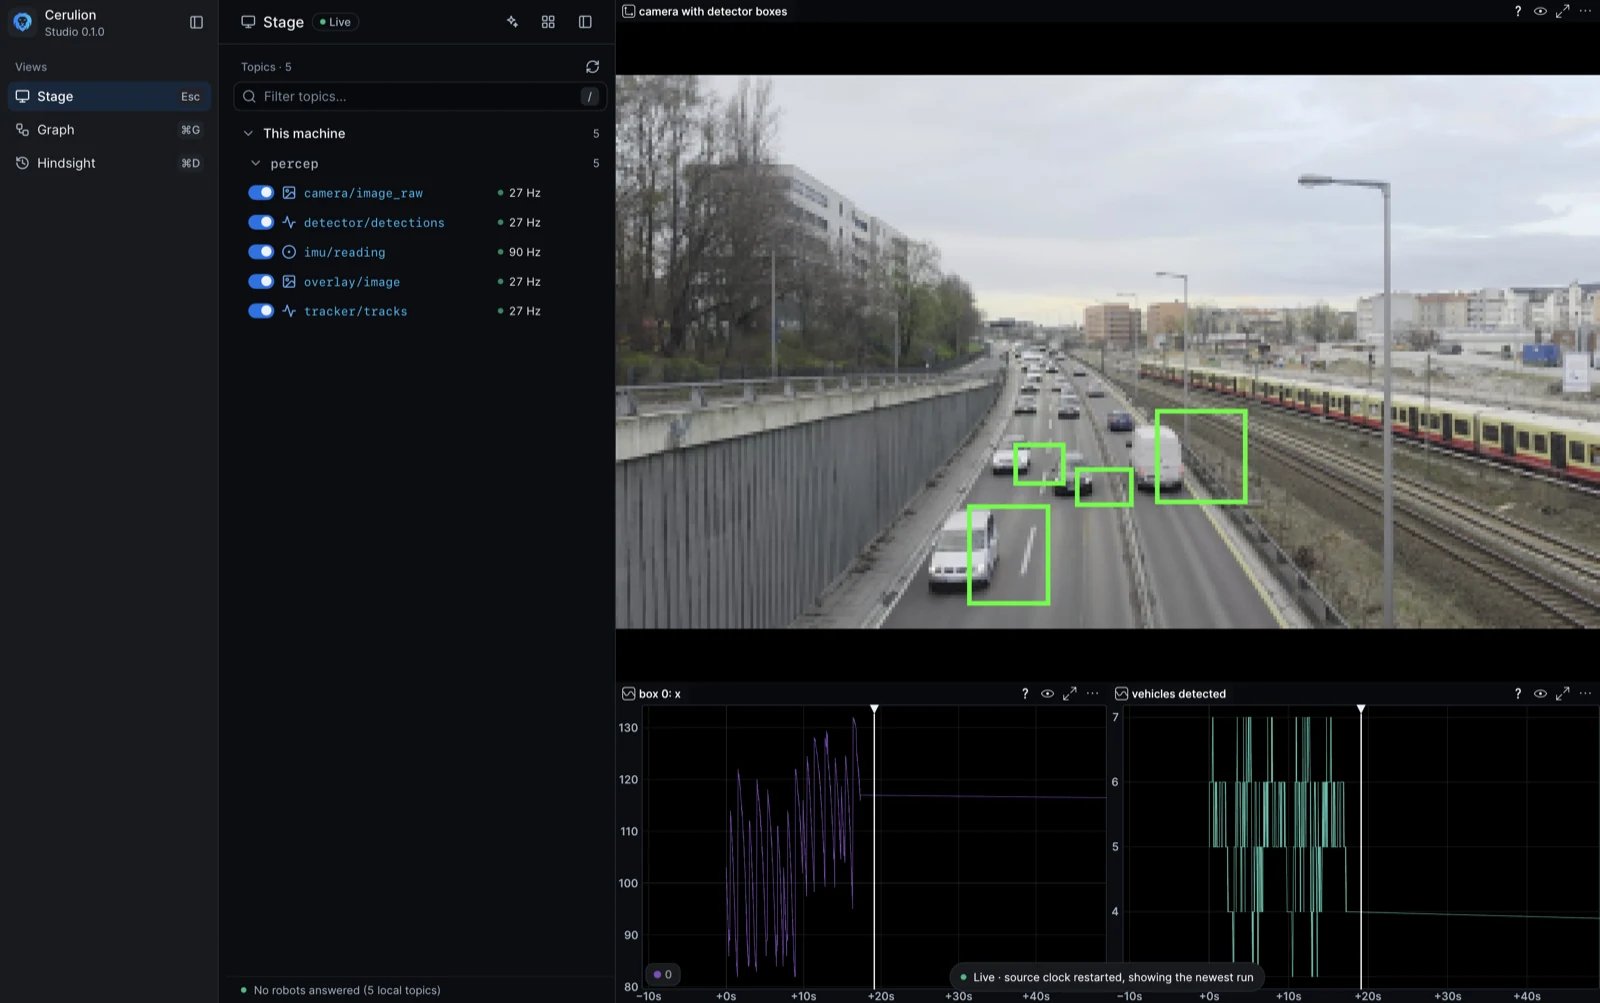
The same stage after a detector fault: the boxes no longer sit on the cars.
The Graph view
The Graph view (⌘ G) shows the graph thatcerulion graph run is running on this machine or on a robot, read from that run’s effective graph file. Each node shows its rate and whether it is alive. The view is read-only: you change a graph in its YAML and re-run it.
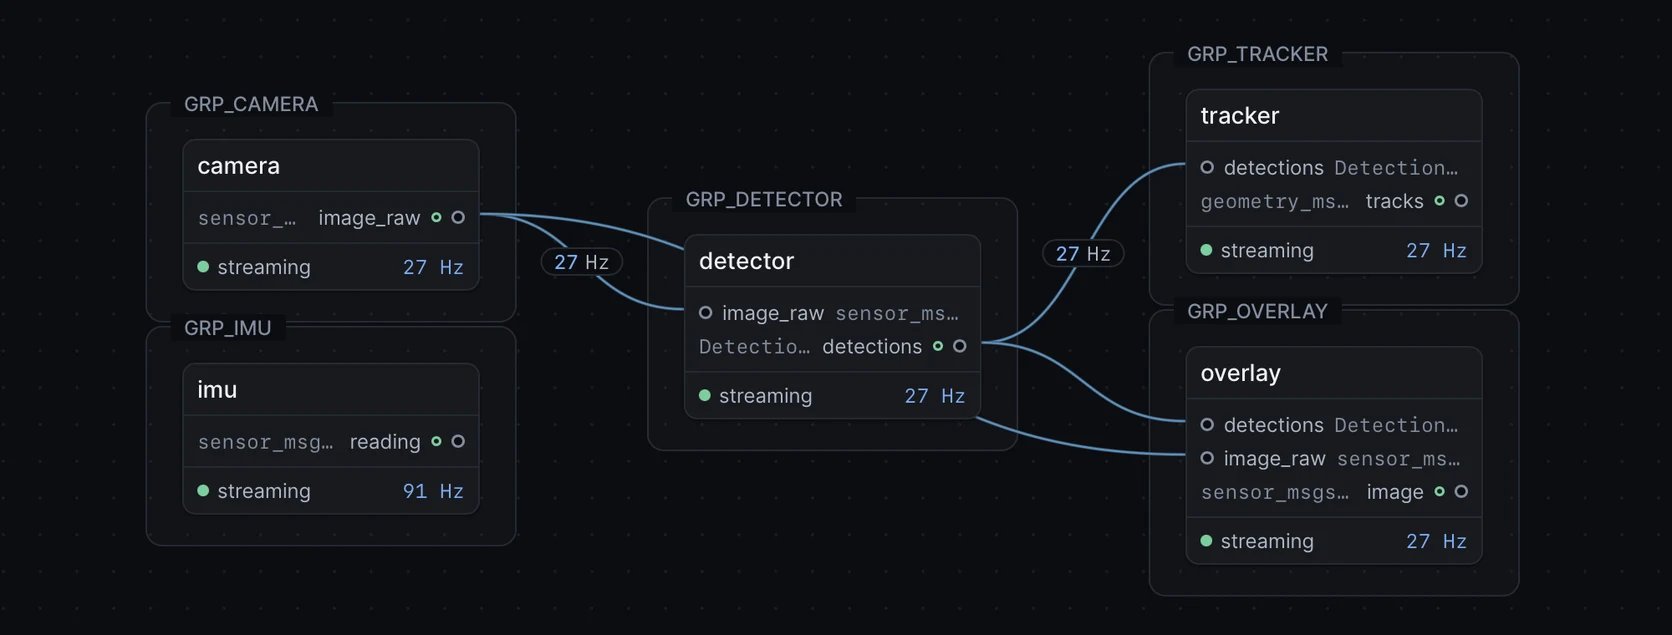
The Graph view: the camera, IMU, detector, tracker, and overlay nodes of a running graph, each streaming at its rate.
Hindsight and the agent dock
The Hindsight screen (⌘ D) opens an.mcap recording, indexes it on your machine, and names the moment it went sideways, with the messages behind each moment. See Hindsight.
The agent dock (the sparkle icon, top right) is an AI agent you ask questions in, such as “why did the detector drift here?”. On the Hindsight screen it answers with Hindsight’s tools. Studio checks that each claim cites a real message from the recording, and it refuses an answer it cannot ground.
The agent dock uses your own Anthropic API key, which you add from the key icon in the dock, and it needs a network connection. The rest of Studio does not use it.
Gotchas
- Studio needs the
cerulionCLI on yourPATH. It drives the same CLI you use in a terminal. Install the CLI first, or set its path in the sidebar’s settings. - Studio needs a Cerulion account. You sign in when the app opens. A stored session keeps working offline for up to 30 days.
- Studio is a macOS app.
- Studio shows a recording that
cerulion bag playplays. Use plainbag play, not--resim, to pace the stage. Only Cerulion recordings play this way; a ROS 2 or Foxglove sample MCAP does not. - The Hindsight screen needs the
hindsightbinary. It is not inside the Studio app. Studio looks for it on yourPATHand in the usual install folders, such as~/.cargo/binand/opt/homebrew/bin.
Get access
Studio is available to teams by request. Tell us about your robot and we’ll set you up.Request access to Studio
Book 15 minutes. Bring your robot, your graph, or a recording you want to investigate.